PLANT CELL ATLAS
  • Home
  • About
    • People >
      • New People
    • Motivation
    • Goals
    • Milestones
    • Affilations
    • News >
      • Breaking News
      • Past News
    • Code of Conduct
    • Bylaws
  • Events
    • PCA Multiplex Microscopy Symposium - May 2022 >
      • Organizers
    • 2021 PCA Symposium - Dec 2021 >
      • About
      • Registration
      • Abstract Submission
      • Speakers
      • Schedule
      • Organizers
    • Spatial Metabolomics Workshop - Oct 2021 >
      • Organizers
    • Writing Accountability Group - Sept 2021 >
      • Organizers
    • Career Panel - Jul 2021 >
      • Organizers
    • ICAR 2021 Mini-Symposia >
      • Quantitative Imaging
      • Arabidopsis Algorithm
      • Quantitative Development
      • Quantitative Proteomics
      • Organizers
      • Single-cell Landscape
      • Arabidopsis Informatics
    • Spatial Proteomics Workshop - Apr 2021 >
      • Organizers
    • Single Cell Sequencing Workshop - Feb 2021 >
      • Organizers
    • Inaugural Workshop - May/Jun 2020 >
      • Organizers
  • Resources
    • PB22 Travel Award
    • Job Posts
    • Fellowships
    • Publications >
      • 2022 Plant Physiology Focus Issue
    • PCA Videos
  • Outreach
    • PCA Art Exhibit >
      • About
      • Plant Biotechnology
      • Black Plant Scientists
      • Bowie State University
      • Howard University
      • Morgan State University
    • Futurum Brochure
  • Contact
 

Undergraduate Fellowships


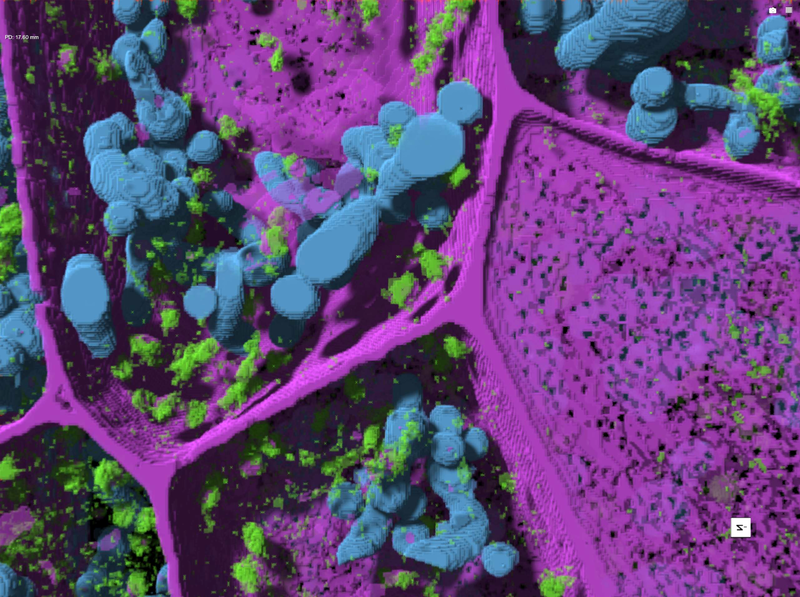
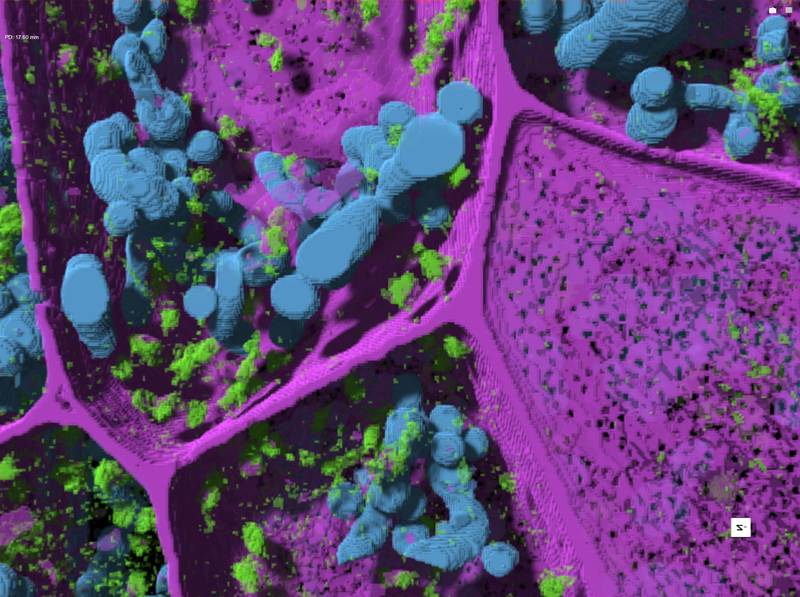
Deep learning and 3D isosurface rending reveals the spatial relationship of cell mitochondria (blue), Golgi and Golgi vesicles (green) and cell wall with plasmodesmata voids (magenta) in barley root using serial block-face scanning electron microscopy. Photo credt: K. Czymmek
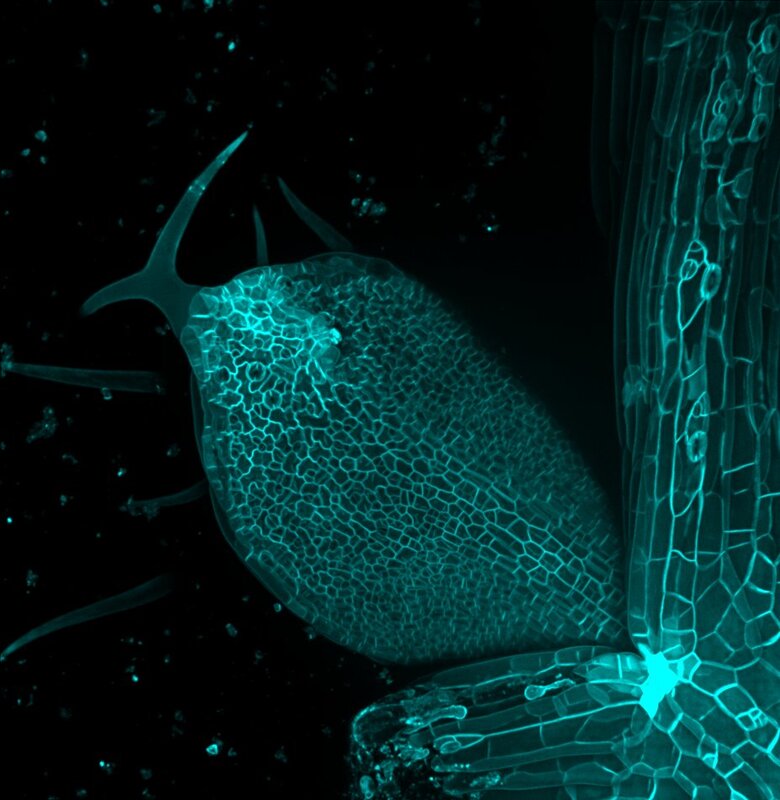
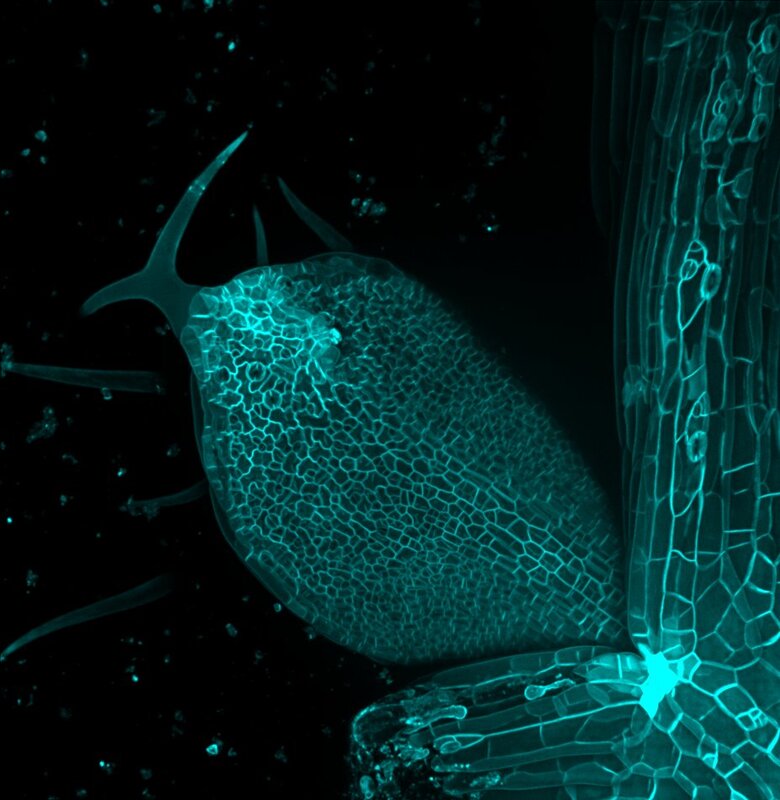
Reconstruction of an Arabidopsis first leaf from a six-day old seedling. Photo credit: F. Bossi
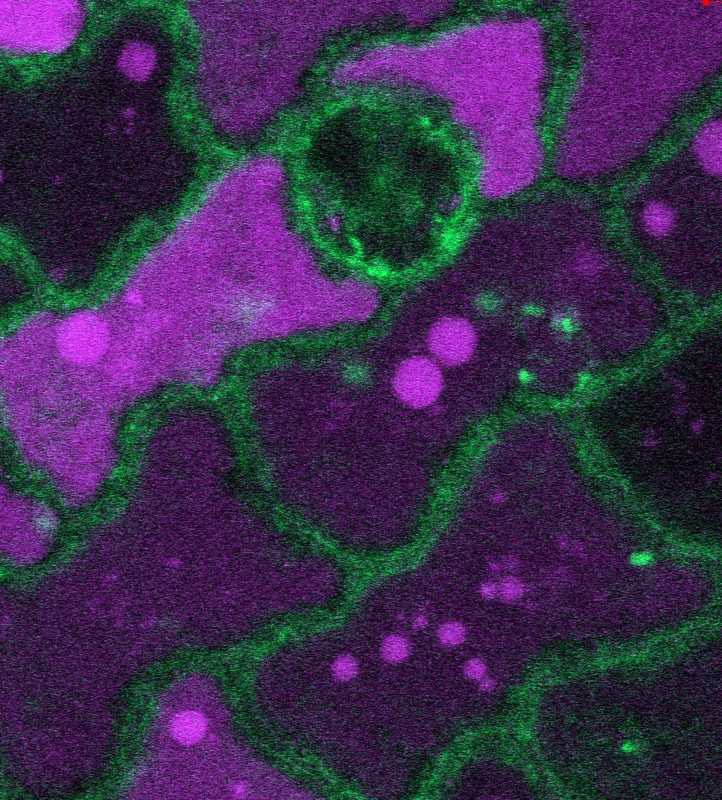
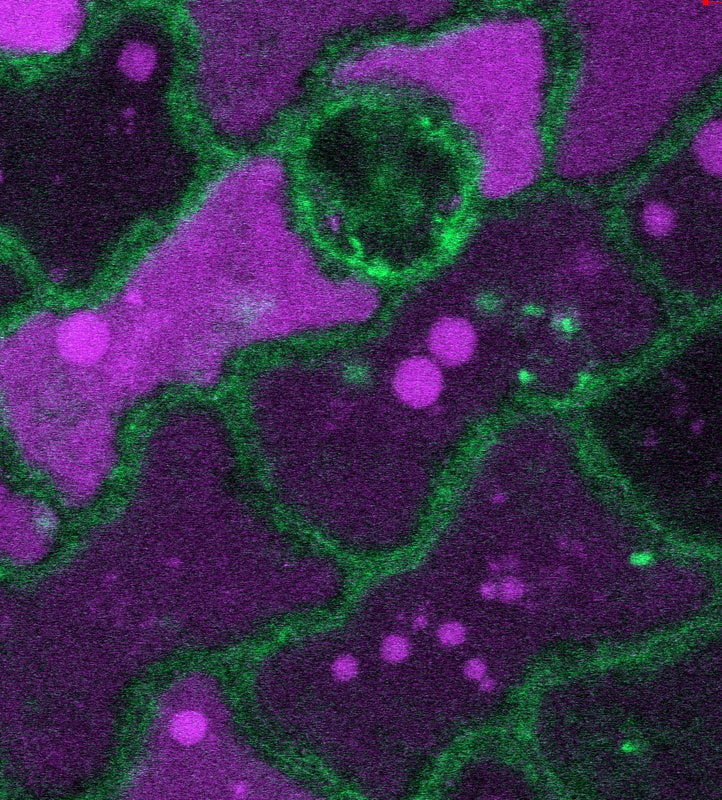
ER marker (green) and anthocyanin (magenta) in Arabidopsis epidermal cells. Photo credit: Alexandra Chanoca (Otegui Lab)
 

Graduate Fellowships


Deep learning and 3D isosurface rending reveals the spatial relationship of cell mitochondria (blue), Golgi and Golgi vesicles (green) and cell wall with plasmodesmata voids (magenta) in barley root using serial block-face scanning electron microscopy. Photo credt: K. Czymmek
Reconstruction of an Arabidopsis first leaf from a six-day old seedling. Photo credit: F. Bossi
ER marker (green) and anthocyanin (magenta) in Arabidopsis epidermal cells. Photo credit: Alexandra Chanoca (Otegui Lab)
 

Post-Doc Fellowships


STANFORD LAND ACKNOWLEDGEMENT
“The Plant Cell Atlas operates predominantly out of the Carnegie Institution for Science's Plant Biology Department located at Stanford University. Stanford sits on the ancestral land of the Muwekma Ohlone Tribe. This land was and continues to be of great importance to the Ohlone people. Consistent with our values of community and inclusion, we have a responsibility to acknowledge, honor, and make visible the University’s relationship to Native peoples.”
Carnegie Institution for Science
Department of Plant Biology
260 Panama St.
​Stanford, CA 94305
National Science Foundation logo. A blue globe with
Grant #'s: 1916797 & 2052590
Carnegie Science logo on the left. The logo depicts a circle with a sytlized dark blue starry sky at the top, a brown ammonite fossile on the bottem left, and a stylized green leaf on the right. Text to the right of the logo states
BASF logo. Logo is an orange rectangle with the text
  • Home
  • About
    • People >
      • New People
    • Motivation
    • Goals
    • Milestones
    • Affilations
    • News >
      • Breaking News
      • Past News
    • Code of Conduct
    • Bylaws
  • Events
    • PCA Multiplex Microscopy Symposium - May 2022 >
      • Organizers
    • 2021 PCA Symposium - Dec 2021 >
      • About
      • Registration
      • Abstract Submission
      • Speakers
      • Schedule
      • Organizers
    • Spatial Metabolomics Workshop - Oct 2021 >
      • Organizers
    • Writing Accountability Group - Sept 2021 >
      • Organizers
    • Career Panel - Jul 2021 >
      • Organizers
    • ICAR 2021 Mini-Symposia >
      • Quantitative Imaging
      • Arabidopsis Algorithm
      • Quantitative Development
      • Quantitative Proteomics
      • Organizers
      • Single-cell Landscape
      • Arabidopsis Informatics
    • Spatial Proteomics Workshop - Apr 2021 >
      • Organizers
    • Single Cell Sequencing Workshop - Feb 2021 >
      • Organizers
    • Inaugural Workshop - May/Jun 2020 >
      • Organizers
  • Resources
    • PB22 Travel Award
    • Job Posts
    • Fellowships
    • Publications >
      • 2022 Plant Physiology Focus Issue
    • PCA Videos
  • Outreach
    • PCA Art Exhibit >
      • About
      • Plant Biotechnology
      • Black Plant Scientists
      • Bowie State University
      • Howard University
      • Morgan State University
    • Futurum Brochure
  • Contact